|
 
- UID
- 2
- 积分
- 2736444
- 威望
- 1318218 布
- 龙e币
- 1418226 刀
- 注册时间
- 2009-12-3
- 最后登录
- 2024-5-17

|
3#
 发表于 2021-2-6 14:35
| 只看该作者
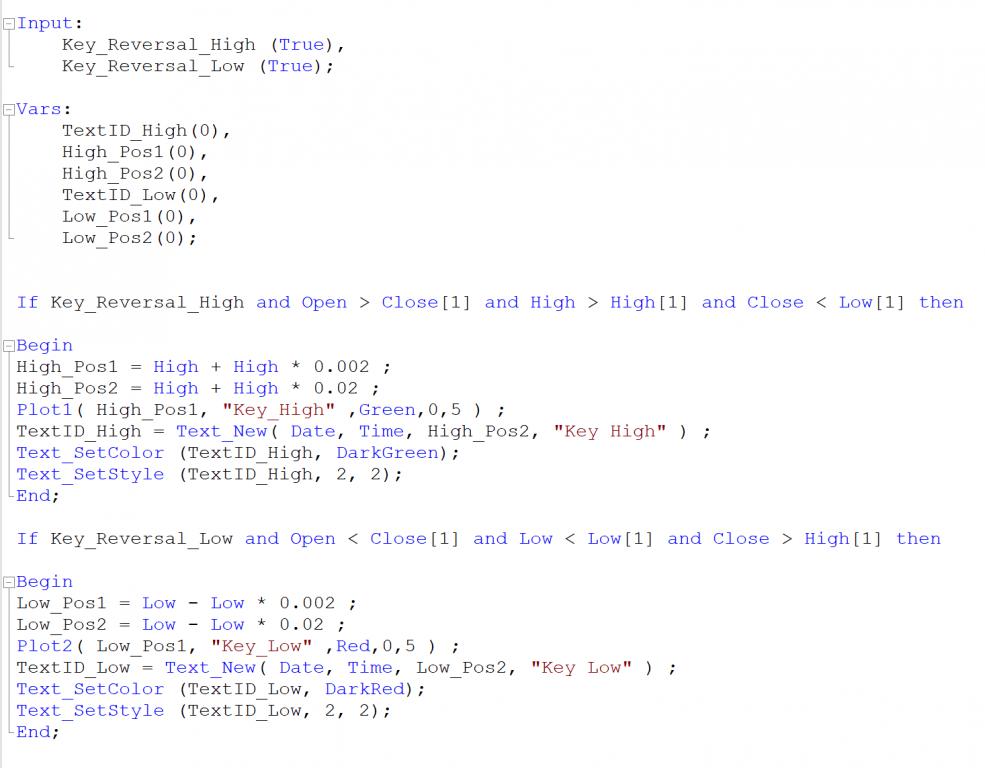
Volume filter
The Key Reversal Pattern generally shows a violent price movement. The price could change direction if institutional traders open large positions. If this is true, you will also observe an increase in volumes.
To add this filter you have to create a Volume Moving Average.
MA_Volume = Average(Volume, 20);
When the daily Volume is bigger than his 20 periods moving average, the pattern is valid.
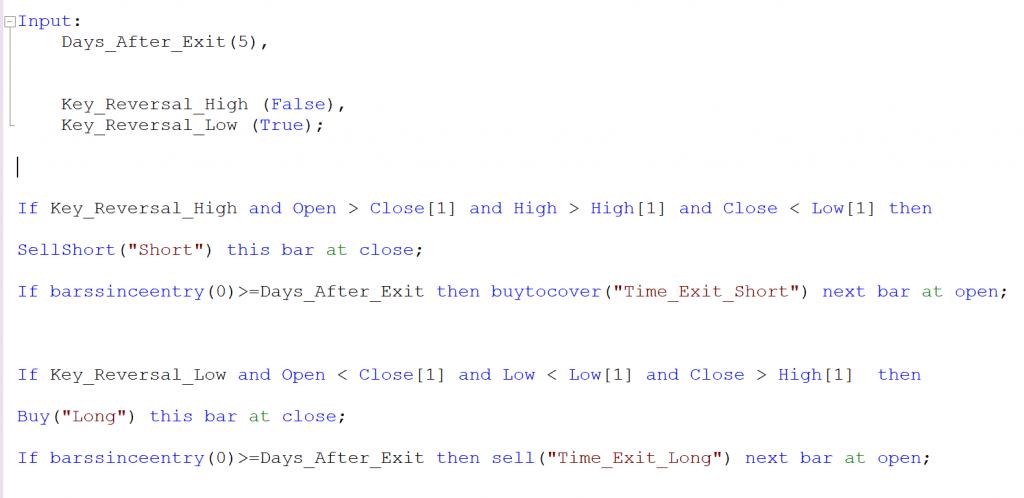
Conclusions
The Key Reversal Pattern could work as a filter, but it occurs too rarely.
We test the long side of this system with 18 U.S. major stocks over a 20 year period, $10,000 for every trade with no stoploss with a 5 days schedule to exit the trade.
This is the video with the trading system results in TradeStation:
We observe many good results so this pattern could be a valid filter for many instruments.
If you use the key reversal as a filter, remember that the overall number of trades that you will decrease, because this pattern is infrequent.
It’s also important to consider the trend, the reversal is only noise in a range-bound market.
Also, support and resistance are important, because near this area the pattern is stronger.
As a discretionary trader, you could create a market scanner for a large portfolio of Stocks. |
|
 |
|  |
| 


 微信:
微信:
 :
: :
:
 2024年最全的Python编程与程序化(量化)教程、视频、源码、课件、资源汇总贴:/thread-152864-1-1.html

 2024年期货开户限时优惠:政策一:品牌期货公司开户,特惠佣金费率;政策二:短线炒单及大资金享高比率返佣;政策三:可申请交易所保证金比率(具体咨询客服);政策四:享论坛VIP会员资格免回复看贴、千部电子书一键下载。