

 图片附件: FTS_MAY15_FINAL_MD.jpg (2019-2-17 18:00, 16.79 KB) / 下载次数 34
I recently had a conversation with industry stalwart and head of Wedbush Futures Carl Gilmore, and he mentioned that he and other leaders in the FCM space have had discussions wondering who will be the leaders of the industry 20 years from now.
He wasn’t pining for the floor but knew that most leaders had their formative years on the trading floors. Of course, notable exceptions are CME Group CEO Phupinder Gill and Intercontinental Exchange (ICE) Chairman and CEO Jeff Sprecher.
Still, I understood what he meant.
Those of us who had spent a considerable amount of time on the trading floor understand as well. We all have had similar conversations regarding the difficulty in explaining to a spouse or friend how it all works. It is one thing to learn something in a book and quite another to live it. That is why anecdotes from significant—and not so significant—events on the floor, or “floor stories,” are so compelling (see “Tales from the pit"). There is comedy and drama there.
To see the markets working live with the flurry of people and movement of prices and the different levels of noise that accompany certain activity, paints a three-dimensional picture that captures its essence, which can’t be duplicated in a book or seminar.
All of your senses are at work. If you talk to the old timers, nearly all, man or woman, say their attraction to the industry was a visceral one based on their interaction with the floor. The excitement of it. It wasn’t simply the idea that great sums of money could be made but the idea of action.
What is replacing those market makers and traders largely is high-speed algorithmic traders. Perhaps it is more efficient. It can be and it also can be an attempt to game the market—something that occurred in the heyday of the floor as well. In that sense it is just about the changing tools used to exploit opportunities.
However, you won’t find the passion and love there. Those programmers will go to where the opportunities are. That is not good or bad, it is simply reality. The question is: How will this new reality affect markets? A computer coding algorithm course — even with the promise of big bucks — is not going to draw the young risk-taker into the futures markets the way the action of the floor did.
Perhaps the young gamers who will be the traders of the future will get that same rush trading as they do with “Total War,” or whatever the popular game of the day is.
Transitions can be tough but they also can be invigorating. Futures will be going through a transition of its own in the coming months. We have been having an internal debate over this transition because we have always been more than a trading magazine.
Futures launched as Commodities magazine in 1972 (This month’s cover pays tribute to Commodities debut cover); in September 1983 we changed our name to Futures because with the influx of financial futures, Commodities no longer encapsulated all that we covered. Even at the time of that change, Futures was a bit limiting and didn’t define all that we covered.
We had been at the forefront of the emergence of the Chicago Board Options Exchange and the listed options markets. We also were at the forefront of the explosion of systematic trading and the growth of the commodity trading advisor universe thanks to the emergence of the personal computer. Many of the groundbreaking works of technical analysis and trading system development were featured in the pages of Futures.
In this issue we include a review of Richard (Doc) Sandor’s new book, “Sustainable Investing and Environmental Markets: Opportunities in a New Asset Class,” which he coathored with three others. Sandor represents both a bridge to the emergence of financial futures, which signified our move from Commodities to Futures magazine, and a bridge to the future with his work in environmental markets. Sandor wrote a piece on the use of computers in trading in the very first issue of Commodities. It is a good metaphor for what we have attempted to accomplish over the year and will continue to work on.
We have covered commodities, interest rates, equities, forex and any market traders were interested in from all sides. Simply put, we have been a guide for the modern trader, offering analysis and strategies: Cutting-edge and time-tested. It is something we are proud of and something we pledge to continue as markets change.
We will strive to offer some new features as well. Hence the debate. In a sense we will be doing what we always have done. The industry has looked to Futures to cover trends: in trading, markets, system development and regulation. We have profiled key players inside the futures world and in the world in general, as everything affects markets.
Our contributors have offered futuristic strategies and reached back in time to apply proven trading methods to new markets. In “Darvas box trading: A 21st century blueprint," Billy Williams updates a classic and demonstrates how the modern trader can learn from the past.
It is what we have always done and will continue to do.
Stay tuned.
图片附件: Dan_Signature.jpg (2019-2-17 18:05, 12.88 KB) / 下载次数 29
By Ashraf Laidi May 15, 2015 • Reprints |
The growing parallels between 2015 and 1998 in global market forces—soaring U.S. dollar, plummeting oil prices, rising equities, rising volatility and flattening U.S. yield curve—are startling.
They also have been bolstered by the rise in mergers and acquisitions in the oil and gas industries as falling energy prices force “big oil” to seek economies of scale through strategic tie ups (see “The future of fracking”). Knowing the repercussions of U.S. dollar strength in 1998, should we be concerned with today’s dollar advances?
Last month’s announcement from Royal Dutch Shell to buy BG Group for $70 billion was the first oil and gas mega-merger agreement in more than a decade. The deal will be the year’s biggest and the largest in the oil sector since Exxon paid $82 billion for Mobil in 1999. You may recall 1998 also saw BP’s $55 billion takeover of Amoco, Total’s 图片附件: dollar%20back%20flickr%20alexanderamatosi_2.jpg (2019-2-17 18:07, 28.88 KB) / 下载次数 31
http://www.qhlt.cn/attachment.php?aid=6754&k=ccaa4a31d82b86add4b9625a73262c7a&t=1716076227&sid=em3R3G 图片附件: Forex_It_Didnt_End_Well.jpg (2019-2-17 18:07, 224.54 KB) / 下载次数 37
http://www.qhlt.cn/attachment.php?aid=6755&k=03e0815eeb6ddb1bdf096eefa04be152&t=1716076227&sid=em3R3G
By Dan Keegan May 15, 2015 • Reprints |

How do you trade your opinion that a substantial move in either direction in a particular market is imminent?
Answer:Long straddles or time valued spreads.
During the past six years, the Federal Reserve, headed by Ben Bernanke and now Janet Yellen, has arguably been printing money through various quantitative easing programs. In spite of this, the dollar over the last year has rallied sharply against other currencies, particularly the euro. Recently the European Central Bank, headed by Mario Draghi, has engaged in its own QE program.
Over 2,000 years, gold has acted as an unofficial, and sometimes official, reserve currency. Gold is currently serving in the former capacity, despite the occasional call for the latter. Inflation has been tame, despite all of the money that has been created. Should the velocity of money increase then inflation could explode.
In May 2005 gold traded as low as $421. By August of 2011 it had risen as high as $1,917, a nearly five-fold increase in a little over six years. Gold is trading somewhere near the middle of those respective prices at $1,210. You can almost draw a straight line from five years ago to today. If inflation ignites, the price of gold must go up. If the recent economic gains, although anemic, begin to reverse, there could be another deflationary spiral. This means gold is in a strange situation where a sizable move in either direction is possible. To cover both bases some kind of options strategy is needed.
One strategy would be a long straddle on gold futures. The June 1210 call strike is trading at 19.30 and the puts are trading at 24.00, which makes the cost of the straddle $4,370. This means that the upside breakeven point would be 1253.70. The downside breakeven point would be 1166.70. The maximum loss on this trade is limited to the premium paid, $4,370.
The negative aspect of this trade is the premium decay that occurs on a daily basis. The rate of decay is exponential. Each day the premium decays a little more rapidly than the day before, until the expiration week where it explodes. If gold doesn’t move above or below the two breakeven points, the trade is a big loss. Another way to compensate for the daily decay is to scalp a futures contract against your existing straddle position.
For this to be an effective strategy you would need to be long 10 straddles; a $43,700 commitment as futures rarely move in a straight line. As the market goes up you could sell futures against your options position. Your long calls would protect against an explosion to the upside. If gold retraced, you could buy futures back for a profit. Likewise if the futures headed south, you could buy a futures contract against your options position. When it retraced you could sell the futures out for a profit; your long puts would protect against a sharp tumble to the downside.
Another strategy is the long time value spread. This involves selling options in one expiration cycle against the purchase of options in a further out expiration cycle of the same strike. The sweet spot for this trade is at the strike price when the nearby option is expiring. You want every option that you sell to go out worthless. You want every option that you buy to go to infinity.
The beauty of options is they are three-dimensional; you can profit on direction or volatility. Volatility spikes in gold can be so extreme that it’s easy to lose money being right on the direction, but off on timing. Options can be used to better define risk and reward.
Correction: April’s Option Strategy was written by Randall Liss, not James Cordier. Futures regrets the error.
About the AuthorDan Keegan is an experienced options instructor and founder of the options education site optionthinker.
图片附件: 177844447_3.jpg (2019-2-17 18:08, 10.46 KB) / 下载次数 30 图片附件: OptionStrat_Charts.jpg (2019-2-17 18:08, 184.57 KB) / 下载次数 37
Metals, both precious and base, say a lot about the direction of the global economy. They are the foundation of economic growth, and gold—besides being used as a currency and store of value—is the original fear gauge.
Crises, quantitative easing and global macroeconomics all affect the metals market. Knowing what fundamental drivers move these markets helps metals traders anticipate where they should be priced today and in the coming years.
Every year the metals markets face a different set of challenges. This year, gold traders are plagued with the U.S. Federal Reserve and European and Far East central banks going in different directions. The Fed is looking at tightening in 2015, the Eurozone is rolling out its version of QE and China—which is now the largest gold producer in the world—is attempting to stimulate its economy.
“With the U.S. dollar spiking upward this year and the Fed expected to tighten monetary policy at some point in June or September, it’s a challenging environment for gold prices,” says Patricia Mohr, vice president, economics, and commodity market specialist at Scotiabank. She expects gold to trade lower in 2015.
China is always a factor. “A lot of metals traders are worried about China’s economy. They’re throwing their hands up in the air and saying, ‘China is going to slow down; the world is coming to an end,’ but it’s not so,” says Pete Thomas of Zaner Precious Metals.
“China’s economy is like everyone else’s; it’s going to get hot, it’s going to get cold. The thing is, people in China strongly believe they need to own gold—that demand will always be there,” Thomas says.
“Many years ago I knew this Chinese gentleman who would purchase gold coins every month,” Thomas says. “I asked him why and he said he used to be a police officer in a province in China where there was a revolution, and his home and police station were burned to the ground. He moved his family to Hong Kong. All he had when they arrived were a few gold coins. He would pay for rice, clothing and shelter with shavings from those coins. Since then he’s never been without gold coins. It goes to the underlying fundamentals of gold—that it always holds value. It can be traded anywhere, anytime for goods or services.”
Here in the West we can debate the usefulness of gold as a last resort currency, but there are enough people in the world with this gentleman’s perspective to support demand.
“Why gold? Because it’s the only real currency there ever was,” Thomas says. “The only paper money that hasn’t gone to zero at least one time or another in its history is the U.S. dollar—and our turn will come,” he jokes, seriously.
Now that Iran and the United States have created a framework for a nuclear accord, it will allow the Middle East the ability to trade gold as never before—and it’s going to lead to a monstrous shift for gold trading to the Middle East, according to Thomas.
Gold traders hedged their bets in the run-up to the framework of the deal, which Thomas expected would be positive for gold. “The Iranian people love gold and after the agreement was reached, gold turned slightly higher. Now I expect Iranians will flood into the gold market as buyers and the price of gold will [keep going higher] due to this increased demand,” Thomas says.
This could work out well for all our refiners and recyclers, as a new solid recurring source of demand will throw a floor under the metals in short order.
The U.S. dollar also is playing its role in moving the gold market. The dollar has softened from the surprisingly weak March employment situation report (see “Complex relationship,” below).
“We had a debasement of currencies due to political events in various parts of the globe,” says George Gero, vice president of Global Futures RBC Capital Markets and long-time gold trader. “This saw investors turn to gold, which is liquid, portable and has no political allegiance.”
Even New York Fed President William Dudley said the first quarter looked weak and the Fed seems to be in no hurry to raise rates, which means that instead of June, we’re now looking at September for rate increases.
When the market believes that the Fed will delay monetary policy tightening, gold prices rally.
“The Fed has recently indicated that it will look at a variety of financial and economic factors—as well as employment conditions and inflation—in deciding upon the timing of any Fed funds rate hike,” Mohr says. “This probably means the Fed has been concerned over the strength of the U.S. dollar and the negative impact on U.S. exports and employment.”
“However, the general concern over when the Fed will tighten will continue to restrain gold prices in 2015—more specifically, this is why I expect gold prices to average less in 2015 than in 2014,” she says.
The Fed will, most likely, need additional weak economic numbers to alter its course but the soft Q1 numbers have supported gold.
“This has caused gold to go up $20 alone in trading on the first trading day of the second quarter (April 6),” Gero says (see “Gold edges up,” below).
Gold performed poorly during the first quarter of 2015 because of interest rate fears and a very strong dollar. But traders looking at higher crude prices and seeing a softer dollar and continued lower interest rates are now looking at gold as an asset allocation during the first week of the second quarter, when they weren’t looking at it in this way last quarter.
Gero expects gold to trade between $1,200 and $1,300 an ounce by the beginning of the third quarter.
He says soft economic data is creating the possibility the Fed will delay the timing of the initial Fed funds rate hike, which lifted gold back to $1,185 in late March. Gold had dropped as low as $1,143 in mid-March when the euro fell just below $1.05.
Mohr sets $1,185 as an average in 2015, down from $1,266 in 2014. “Gold may stay a little bit lower in the next 12-18 months, but by 2017 gold prices could very well start rising again,” she says.
Meanwhile, Thomas expects gold prices to take one more brutal dip this year around June, but will find a floor around support at $1,000, which he expects will hold until the market starts to creep back up to $1,500 to $1,600.
Copper is a bellwether for economic growth. It is affected by automobile and home sales and economic stimulation in the United States, the Far East and in Europe. The average house has 400 pounds of copper and the average car has 40 pounds, so home and auto sales are very important to copper traders.Copper traders often look to China as a guide to where copper is headed.
What’s going on in China is having even an even greater effect on copper than gold right now, according to Gero.
China has implemented fiscal stimulus and there is some expectation that the People’s Bank of China may ease monetary policy further near-term to achieve stronger corporate banking lending and its gross domestic product growth target for this year.
China’s national reform and development commission has set its GDP growth target for this year at 7%. Last year they set it to 7.5% and it actually grew 7.4%. China has a peculiar way of nearly always hitting its targets, so the point is that they are anticipating sluggish growth. Growth is slower than it was, which is to be expected, because for about five years it had near double-digit growth. Its potential to grow is gradually slowing over time, which is just a natural development (see “Emerged,” below).
“We had some economic indicators for China in January and February that weren’t particularly robust...” Mohr says. “...with the industrial activity decelerating in China to only 6.8% year-over-year when a year ago it was growing at about 10%. I expect China’s industrial activity will pick up a little in the first quarter, but definitely as we move into the second quarter because China has a seasonal pattern.”
Concerns about growth prospects in China have less to do with its GDP growth target, and more to do with the idea that China will be growing at a slower pace. But it’s important to note that doesn’t mean that raw material demand is declining, it’s still moving at a solid pace, particularly in copper (see “Copper leads,” below). It’s the pace of increase that’s slowing and therefore the demand in raw materials also will slow.
“This makes the metals and financial markets in London and New York a little nervous because China is responsible for about 47% of world consumption in the four key base metals, while the United States is responsible for less than 9%,” Mohr says.
The sentiment for base metals as a group is going to be a little on the soft side, according to Mohr. “But although the base metals are currently on the weak side, they are due for another bull run later this decade.”
She adds, “Base metals prices have actually inched down this year because unlike previous years, we’ve started this year with very poor sentiment on the outlook for global economic growth. This is unusual because usually at the beginning of every year financial markets become optimistic about the outlook for global growth accelerating, and then in the fall GDP forecasts have been marked down; that’s one of the reasons we typically get a correction in equities markets in September.”
However, she adds that this year things have been quite different. Financial markets actually have had soft expectations for global GDP growth and that has impacted price.
Mining factorRecently gold production slowed down because of cost when crude oil and diesel prices went up because it became more expensive to run the equipment to mine. Then the cost of mining came down substantially and gold crashed from $1,900 to $1,150. It took the market a while to adjust.
“Of course, gold prices will continue to be driven by demand, but mining will be able to keep up and meet demand as far as I can tell,” Thomas says. “What is going to be the driving factor for the next five years is how much demand is going to come out of China, Singapore and India.”
Mohr agrees, “China probably has an even greater gold market than India. China is a huge gold miner. A lot of gold miners have deferred production of gold, and gold prices may lag until mining ramps back up.”
It should be noted that miners in Canada are benefitting from double-digit currency depreciation and low diesel costs, offsetting much of this year’s weaker prices for both gold and base metals, according to Mohr.
Platinum and palladium’s turnMany traders don’t know that platinum is used for cracking crude oil into heating oil and gasoline by the oil industry, says Gero.
“So it’s not just jewelry sales and automobile production that have helped platinum. Also, Russian sanctions have led the oil industry to stockpile platinum. So the price difference between platinum and gold is starting to narrow,” Gero says.
He says copper and platinum will see higher prices this quarter—around $2.70 to $3.00 for copper and $1,175 to $1,200 for platinum.
“A lot of people are writing off platinum because they’re saying they’re going to find another metal that will have the same reactive properties, but I don’t see anybody changing the periodic table anytime soon,” says Thomas.
He said that just recently, the South African government announced they need 1,000 metric tons of platinum for its electrical program and platinum rebounded.
He says platinum and palladium will experience increased demand this year and they are worth following.
Mohr is optimistic on the outlook for zinc, which is her favorite base metal for investors. She expects zinc to perform much better than copper because of current zinc mine depletion. “While zinc may be soft now, prices will start to move higher and it will perform relatively well in the next two to three years,” she says.
As always, the price performance of the metals is going to depend greatly on interest rates, the price of crude, the price of currencies and the behavior of interest rates. But metals traders also should keep an eye on China and Iran this year to see how they move the markets.
图片附件: Markets_Complex_Relationship.jpg (2019-2-17 18:09, 202.02 KB) / 下载次数 30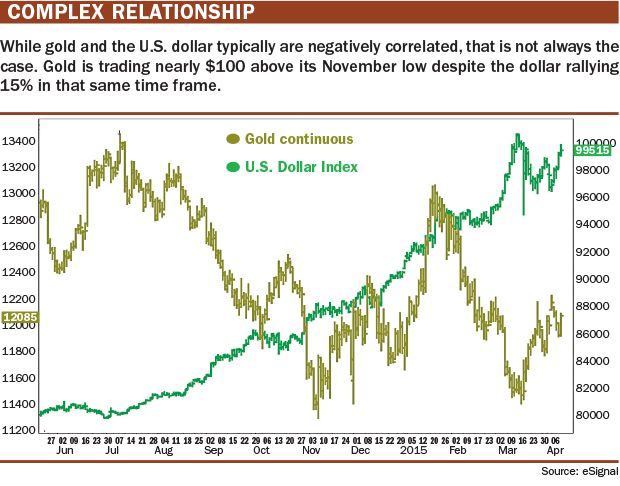 图片附件: Markets_GoldEdgesUp.jpg (2019-2-17 18:09, 214.17 KB) / 下载次数 34
 图片附件: Markets_Emerged.jpg (2019-2-17 18:09, 153.62 KB) / 下载次数 32
 图片附件: Markets_CopperLeads.jpg (2019-2-17 18:09, 196.77 KB) / 下载次数 38
Sustainable Investing and Environmental Markets: Opportunities in a New Asset Class
by Richard Sandor, Murali Kanakasabai, Rafael Marques, Nathan Clark.
World Scientific Publishing Co. Pte. Ltd. 2015
$68.00
380 pages.
In sum, Sandor is an intellectual force to be reckoned with. This latest volume examines environmental issues with more than just an eye toward conservation and increasing the societal benefit. In true Chicago style, he and his co-authors explain how to develop tradable markets around these issues and, more importantly, how to make money doing so. Incentivize them, and they will come.
The emphasis here is on how to price the asset and allow the free market to determine the types and magnitudes of the reductions. While not directly taking governmental interference to task, the authors show a clear preference for traveling with just a carry-on, rather than the bulky baggage that government programs seem to require. There is a place in the system for regulation of these programs, but it should be more for the authorization of the market and enforcement of the rules, not the implementation.
One example is the original sulfur dioxide auctions. Enabled by the Clean Air Act Amendments of 1990, the first auction was held through the Chicago Board of Trade in 1993. Since then, SO2 (and nitrogen oxide) emissions are more than 75% lower than 1980 levels.
Just as important, health costs for lung disease were lowered, as were smog levels, forest damage and acidification of lakes and rivers. This was accomplished because regulation helped create the functions that enabled a market to emerge: It legalized the asset class as a commodity; it produced the property rights needed; and it established the infrastructure to allow for transfer of the asset. Then the market took it from there.
In the past 20 years, cap-and-trade has been burdened with a great deal of political baggage, primarily from those whose oxen will be gored by change, as is often the case. Yet there are now enough programs operating to ensure that their benefits will continue to grow.
But this is not a book about cap-and-trade programs or policies. Nor does it purport that cap-and-trade is the only way to go. This is a roadmap on how to develop markets to allow for other environmental assets to be priced and traded. Early on, the authors outline a seven-stage market development process that is needed. It is no surprise that the first three are similar to the three requirements outlined by Francis Fukuyama in his recent book, “The Origins of Political Order,” in which he says that a political state needs infrastructure, laws, and accountability in order to survive. So it is with a market as described here, albeit writ small. But the ideas presented here are not small.
The first step is the recognition that the structure currently in place needs to be changed due to demand factors. Later explanations bring into play such examples as the “tragedy of the commons,” a concept articulated by many, but notably by Mancur Olson (see “The Logic of Collective Action: Public Goods and the Theory of Groups”). It is here that we find the root of a market. Public goods vs. private goods and collective decisions vs. individual decisions are what make a market. Large groups operate differently than small groups and still more so than individuals. Their resulting decisions are based on the economic pressures affecting each of them, and by the incentives each is given. This is what makes a market.
Secondly, there must be rules, preferably developed by the needs of the market. Chief among these is that the commodity must be transferable. This requires that someone can own it and then be able to sell it to someone else. This notion of property rights has come up before. Almost 30 years ago Hernando de Soto Polar’s book, “The Other Path, championed property rights as a means out of third-world poverty.”Ownership allows for buying and selling and, more importantly, establishing a value and price for doing so. If you don’t own it, its value doesn’t matter, and you don’t take care of it. As Larry Summers famously said, “No one ever washes a rented car.”
The third component is accountability. We are careful here to distinguish between the rules that the market needs in order to work, and the regulations the market overseers need to ensure a level playing field. In Washington, this means regulation and enforcement. In Chicago, this means clearing: a neutral third party to ensure that buyers pay and sellers collect.
Covering such diverse asset classes as emissions, renewable energy, weather-related events and water, and even global fisheries, this book details the necessary steps to develop each into a tradable market. Once a market is created, it can establish a price for the underlying commodity. This price will then become the driver for individual and collective behavior, because the price will factor in all the tangible and intangible (read societal) inputs from the disparate market participants.
Sandor’s three co-authors all have a long history of commitment to environmental issues. They have each been Managing Directors of Environmental Financial Products (EFP) and were involved in the Chicago Climate Exchange (CCX). Murali Kanakasabai is a Ph.D whose work stretches from the first emissions auctions to designing some of these new products. Rafael Marques has been in all phases of research and development of environmental products for over 15 years, and his portfolio has included the broadening of international growth and relationships for the Climate Exchange and now EFP. Nathan Clark also spent many years with the CCX and EFP before moving on to become a vice-president of Wabashco, LLC, a clean fuels, carbon offset and renewable energy development company. These are four men who have proven their dedication to helping the planet.
Sustainable Investing and Environmental Markets: Opportunities in a New Asset Class is an important book in an important emerging field. We are currently at a place in the history of commodity markets similar to that of the 1970s when the first financial products were introduced. Back then the corn and pork belly traders couldn’t understand how you could trade money and debt. That success may ease the way a bit for this new asset class, but market participants are a sticky group.
They will not embrace a new market until it has proven itself to be viable.
Are we facing, as Shakespeare wrote, “a tide in the affairs of men/Which, taken at the flood, lead on to fortune?” The market will tell us, because that is what a market does.
About the AuthorJay Sorkin is a 40-year veteran of the futures and options markets. He traded at the Chicago Board of Trade and the Chicago Board Options Exchange, and later was on the management team of two start-up electronic exchanges. He has taught futures and options for more than 30 years.
图片附件: Sustainable_Investing.jpg (2019-2-17 18:10, 99.51 KB) / 下载次数 33
The detrended price oscillator (DPO) is designed to filter out the underlying trend to highlight the underlying cycles of price movement. Detrended prices should allow the trader to identify cycles and overbought/oversold levels more easily. The DPO is used to remove trend from price so you can do so more effectively.
The DPO typically is not aligned with the most current prices. It is shifted backward in time; in practice, it is shown that this helps to remove the current trend. Because the DPO is offset to the past, it is not considered a momentum oscillator. It only measures past prices against a simple moving average as a way to gauge a cycle’s high/low range, as well as the cycle’s typical duration.
Long-term cycles are made up of a series of short-term cycles. Analyzing these shorter-term components of the long-term cycles can be helpful in identifying major turning points in the longer-term cycle. The DPO helps with this as well.
CalculationTo calculate the DPO, you specify a time period. Cycles longer than that period are the ones that are removed from price, and cycles shorter than that period are the ones that remain.
First, create an n-period simple moving average (where “n” is the number of periods that you desire in the moving average). Now, subtract the moving average calculation from so many days ago ((n / 2) + 1) from the closing price.
The result is the DPO.
DPO = Close – (Moving Average ((n / 2) + 1)) days ago)
The distance the oscillator is shifted depends on the calculation (n / 2) + 1. For example, a 20-day DPO would use a 20-day simple moving average (SMA) that is displaced by 11 periods ((20 / 2) + 1 = 11). This displacement shifts the 20-day SMA 11 days to the left, which puts it in the middle of the look back period.
The value of the 20-day SMA is then subtracted from the price in the middle of this look back period. In short,
DPO (20) equals the price from 11 days ago minus the 20-day SMA. The DPO is most effective with indicator periods of 21 days or less.
There are several ways to analyze stocks with the DPO.
1. The real power of the DPO is in identifying turning points in longer cycles:
2. You can set overbought and oversold levels based on the observation of past price behavior:
3. Use the DPO to identify the direction of the trend, and then only trade in that direction:
Divergence is another powerful way to apply the DPO. When divergence appears between a detrended price and the current price, it indicates a high probability that the current trend will end soon.
Using this analysis, a buy signal is generated when a new low is formed below the previous low and a corresponding detrended price value is higher than the previous value. Likewise, a short signal is generated when a new high is formed above the previous high and a corresponding detrended price value is lower than the previous value.
Cycles are created in the DPO because the indicator is displaced back in time. The historical peaks and troughs in the DPO provide approximate windows of time when it is favorable to look for entries and exits, based on other indicators or strategies.
In the example “Monthly moves” (below), the stock International Business Machines (IBM) is bottoming approximately every 24 to 30 trading days. Upon noticing the cycle, a trader would look for buy signals that align with this time frame. Peaks in price are occurring every 35 to 41 trading days; likewise, the trader might look for sell/shorting signals that align with this cycle.
Consider how the DPO helps with timing both long and short trades in the S&P 500 (see “Broad market cycles,” below). When the DPO is above the zero line, it means that price is above its moving average; this is a bullish sign. Similarly, when the DPO is below the zero line, it means that price is below its moving average, a bearish sign.
Looking at the S&P 500 chart, we see that on Oct. 16, 2014, the S&P 500 made a low of 1820 and showed an intraday recovery before closing at 1862. The DPO was in the oversold zone, and on Oct. 21, the indicator closed above the zero line, suggesting longs could be initiated at 1941 with a stop loss of the previous day’s low. Profit booking could be done at 2017 on Nov. 4 when the DPO reached an overbought zone.
On Dec. 9, the S&P 500 made a low of 2054 and closed at 2060, while the DPO crossed below its zero line. This suggests that shorts could be taken with a stop loss of the day’s high. Profit booking could be done at 1982 on Dec. 16 when the DPO reached its oversold zone.
Nike (“Turning two ways,” below) provides a good example of using divergence to predict a turning point. In this case, a short signal is generated when a new high is formed above the previous high and a corresponding detrended price value is generated that is lower than the previous value.
Between Feb. 26 and March 18, 2014, Nike was trading in the range of 78-80, making higher highs. However, the DPO was making lower lows, as shown in the chart. This divergent behavior suggests that there was a high probability that the end of the current trend was imminent. On March 21, that end came when Nike opened with a gap lower at 77. By April 7, it made a low of 70.
The DPO shows the difference between a past price and a simple moving average. In contrast to other price oscillators, it is not a momentum indicator. Instead, it simply is designed to identify cycles with its peaks and troughs. Cycles can be estimated by counting the periods between peaks or troughs. Users can experiment with shorter and longer DPO settings to find the best fit.
In all cases, however, it’s important to remember that this is just one indicator. No single indicator can make up an entire trading strategy. Your trades should be confirmed by additional signals, and it’s always important to follow strict rules regarding loss management.
图片附件: TT_B_MonthlyMoves.jpg (2019-2-17 18:15, 181.38 KB) / 下载次数 28 图片附件: TT_B_BroadMarketCycles.jpg (2019-2-17 18:15, 200.9 KB) / 下载次数 26
 图片附件: TT_B_TurningTwoWays.jpg (2019-2-17 18:15, 172 KB) / 下载次数 28
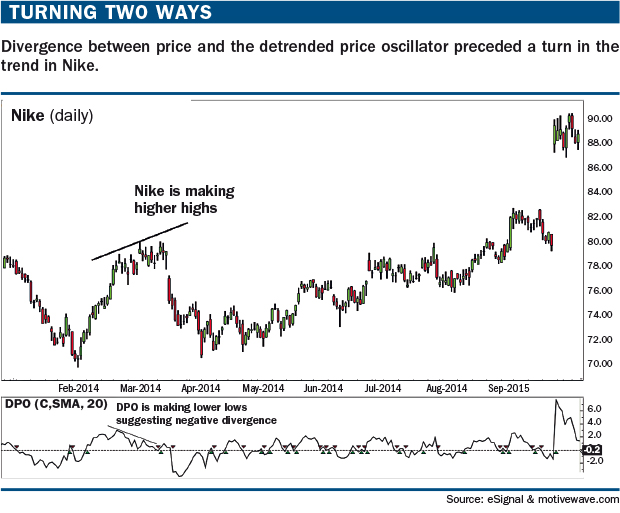
| 欢迎光临 龙听期货论坛 (http://www.qhlt.cn/) | Powered by Discuz! 7.2 |