For this month’s Traders’ Tip, we’ve provided the StiffnessIndicator.efs study based on the article by Markos Katsanos in this issue, “The Stiffness Indicator.” This study attempts to determine if markets are in a strong price trend.
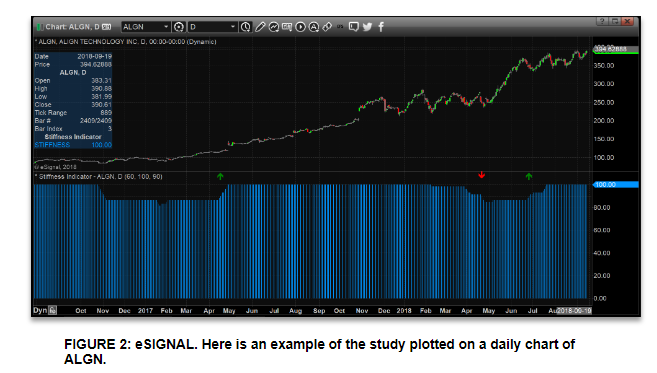
The study contains formula parameters that may be configured through the edit chart window (right-click on the chart and select “edit chart”). A sample chart is shown in Figure 2.
[attach]5571[/attach]作者: 龙听 时间: 2018-11-27 16:50
/*********************************
Provided By:
eSignal (Copyright c eSignal), a division of Interactive Data
Corporation. 2016. All rights reserved. This sample eSignal
Formula Script (EFS) is for educational purposes only and may be
modified and saved under a new file name. eSignal is not responsible
for the functionality once modified. eSignal reserves the right
to modify and overwrite this EFS file with each new release.
Description:
The Stiffness Indicator by Markos Katsanos
Version: 1.00 9/14/2018
Formula Parameters: Default:
Period 60
MA DAYS 100
STIFFNESS CRITICAl 90
Notes:
The related article is copyrighted material. If you are not a subscriber
of Stocks & Commodities, please visit www.traders.com.
**********************************/
var fpArray = new Array();
function preMain(){
setPriceStudy(false);
setStudyTitle("Stiffness Indicator");
setCursorLabelName("STIFFNESS");
setPlotType(PLOTTYPE_HISTOGRAM);
var x = 0;
fpArray[x] = new FunctionParameter("Period", FunctionParameter.NUMBER);
with(fpArray[x++]){
setName("STIFFNESS PERIOD");
setLowerLimit(1);
setDefault(60);
}
fpArray[x] = new FunctionParameter("MAB", FunctionParameter.NUMBER);
with(fpArray[x++]){
setName("MA DAYS");
setLowerLimit(1);
setDefault(100);
}
fpArray[x] = new FunctionParameter("STIFFCRIT", FunctionParameter.NUMBER);


 图片附件: 微信截图_20181127164344.png (2018-11-27 16:45, 70.73 KB) / 下载次数 78