Board logo

标题: [TS源码] Key Reversal Pattern [打印本页]

作者: 龙听    时间: 2021-2-6 14:34     标题: Key Reversal Pattern

Today we analyze the Key Reversal Candlestick Pattern. You will learn how to create and use this indicator in your automatic trading systems. We start with the simple High and Low Bar Reversal.

The Reversal Bearish Bar occurs when:

Today Price High > Yesterday Price High                       
and
Today Price Close < Yesterday Price Close

The Reversal Bullish Bar occurs when:

Today Price Low < Yesterday Price Low                       
and
Today Price Close > Yesterday Price Close

This pattern alone is not very significant, because you can see it appears frequently. Anyway, we create a little trading system to test these signals.

The Trading System opens a short and long position. We stay in a position for X days, without a stop-loss. We stay in a position for X days. Time frame: Daily – SPY ETF for this test.

The results show the inconsistency of this strategy. As we can see, only the long side has an acceptable percent of profitable trades. This means that the price reverses only after a bullish pattern, but not strongly enough. In fact, the average net profit is too small.

So this pattern is not significant even when considered alone. It’s clear that the price doesn’t react fast after. Let’s go to analyze the more specific pattern.

Key Reversal Bar
The Key Reversal Bearish Bar occurs when:

Today Price Open > Yesterday Price Close
and
Today Price High >Yesterday Price High
and
Today Price Close < Yesterday Price Low

The Key Reversal Bullish Bar occurs when:

Today Price Open < Yesterday Price Close
and
Today Price Low >Yesterday Price Low  
and
Today Price Close > Yesterday Price High

The key reversal bars open with a price gap. So, this pattern is only for daily charts because in an intraday chart is very difficult to find a gap.

When you see this pattern, you know that there is a change in the market sentiment. You can see the strength of the price movement that anticipates a change in the direction.

Many times this pattern is like Pin Bar and Outside Day Bar. In this chart, there are two consecutive patterns that are Outside Day and Key Reversal at the same time.
作者: 龙听    时间: 2021-2-6 14:34

If we create another trading system to test this pattern, we can discover that the short side doesn’t work. The long side is profitable, but the number of total trades is too low and is difficult to insert some filters.

6-excel-results2-key-reversal
Why did we hold the position for only 5 days?  Because we would like to understand if the price reacts fast after the pattern.

If you want to use this pattern as a filter, you need to know how fast the price reacts.

If we hold the position for many days, we can see that the results became better.

7-results-with-hold-position-reversal-pattern
We can also try a volume filter for educational purposes.
作者: 龙听    时间: 2021-2-6 14:35

Volume filter
The Key Reversal Pattern generally shows a violent price movement. The price could change direction if institutional traders open large positions. If this is true, you will also observe an increase in volumes.

To add this filter you have to create a Volume Moving Average.

MA_Volume = Average(Volume, 20);

When the daily Volume is bigger than his 20 periods moving average, the pattern is valid.

Conclusions
The Key Reversal Pattern could work as a filter, but it occurs too rarely.

We test the long side of this system with 18 U.S. major stocks over a 20 year period, $10,000 for every trade with no stoploss with a 5 days schedule to exit the trade.

This is the video with the trading system results in TradeStation:

We observe many good results so this pattern could be a valid filter for many instruments.

If you use the key reversal as a filter, remember that the overall number of trades that you will decrease, because this pattern is infrequent.

It’s also important to consider the trend, the reversal is only noise in a range-bound market.

Also, support and resistance are important, because near this area the pattern is stronger.

As a discretionary trader, you could create a market scanner for a large portfolio of Stocks.
作者: 龙听    时间: 2021-2-6 14:36

This is the Code of the Indicator and the Strategy:
指标部分:


信号部分:


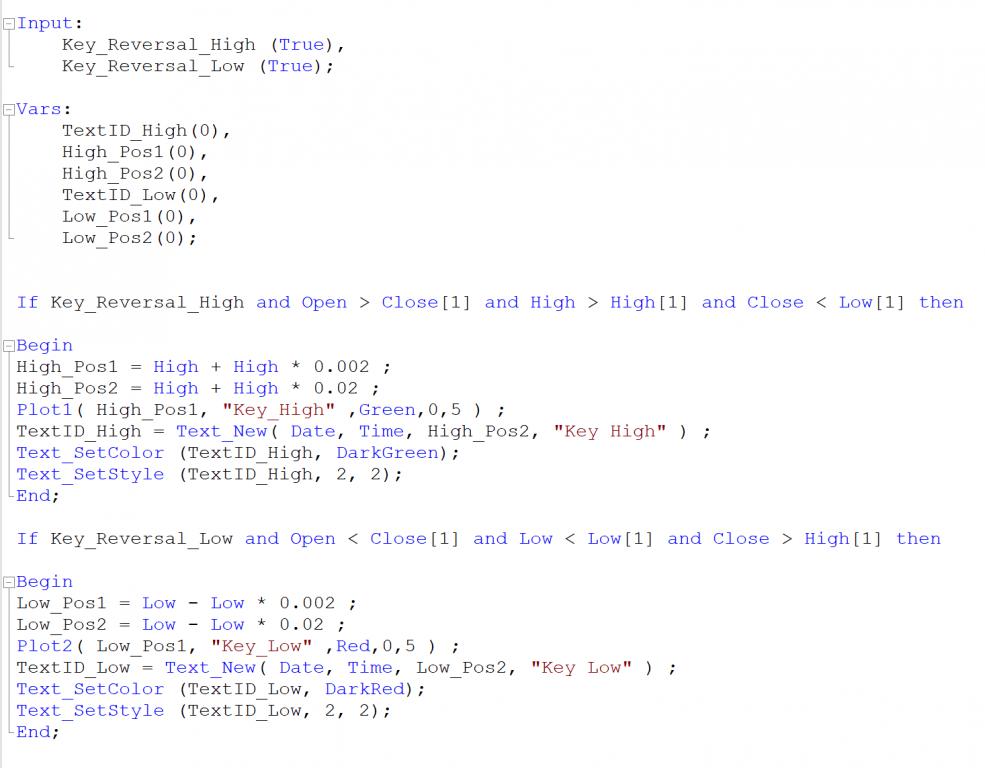
图片附件: 8-TradeStation-MultiCharts-EasyLanguage-Code-Indicator-Indicator.png (2021-2-6 14:35, 37.31 KB) / 下载次数 76
http://www.qhlt.cn/attachment.php?aid=27350&k=0b21dcc25eb78d8617c9ee3861317678&t=1717253991&sid=UTSUu5


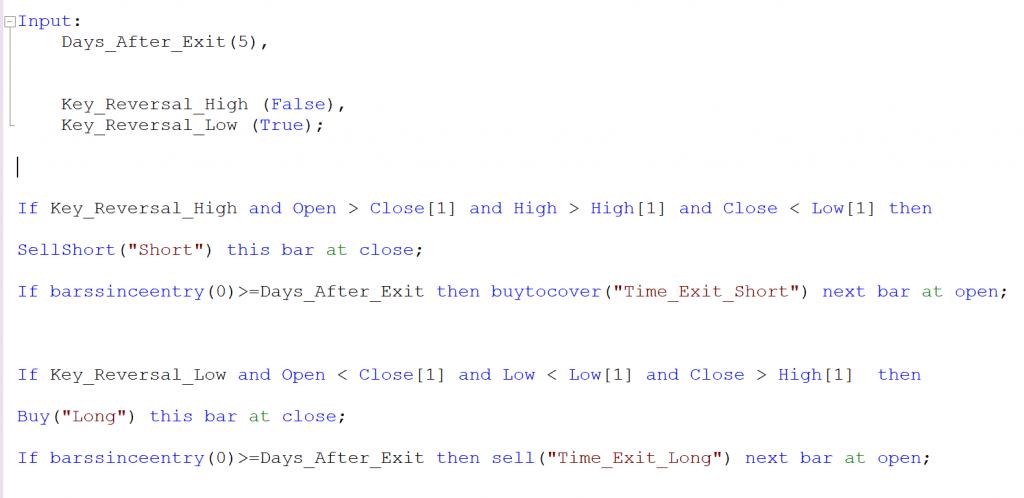
图片附件: 8-TradeStation-MultiCharts-EasyLanguage-Code-Strategy.png (2021-2-6 14:36, 20.9 KB) / 下载次数 72
http://www.qhlt.cn/attachment.php?aid=27351&k=24eea216bd100f535c374951377458a4&t=1717253991&sid=UTSUu5


欢迎光临 龙听期货论坛 (http://www.qhlt.cn/) Powered by Discuz! 7.2